Audio visualizers turn sound into motion and color. They make invisible frequencies visible by translating waveforms and beats into patterns that move with music.
The Idea Behind It
An audio visualizer can detect how much power is in a particular sound, and then show it visually. Since all music signals are composed of multiple frequencies of varying amplitude, when we translate those values into pictures, we get a visual representation of how the sound changes over both time and pitch.
A simple visualizer may respond only to the volume of the sound, whereas an advanced system would utilize the frequency information to create separate representations for the low (bass), middle (mid) and high (treble) frequencies. The advantage to this type of mapping is that different sections of a song will be able to affect various shapes or lights, thus giving each range of sounds its own unique visual expression.
First appearing as analog oscilloscope displays, today’s audio visualizers can be found in many forms including interactive art, live stage projections, and even video game environments. The only commonality among all of these forms is the relationship between the physical data used to generate the visuals and our ability to perceive it as “alive”.
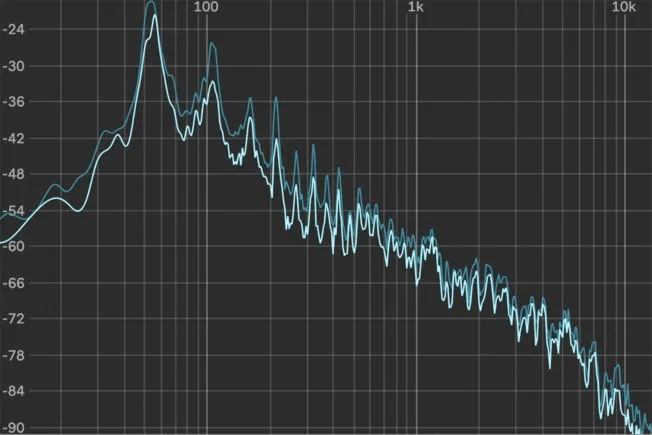
Each frequency band corresponds to a section of the visual output
Building the System
Visualizers today use FFT to divide the waveform of a sound in time and space into individual frequencies. Once each frequency has been analyzed for Amplitude, those values are used to create the animation. Each frequency is then used to determine the animation’s color, size and/or lightness.
To create a unique visualizer design, you need to decide how the data will be mapped onto the animations frame by frame. If you do a smooth transition between frames you get a very fluid looking visualizer. On the other hand, if you do a hard transition between frames you will see a more rhythmic/ mechanical style of animation.
Using a smoothing function for your visuals gives it a natural response to the fluctuations in the sounds as opposed to reacting mechanically to the changes in the sound. Therefore, the visuals become a part of the music as oppose to being just a reaction to it.
What this means
Audio visualizers show how data can become art. They reveal rhythm, energy, and structure in ways that complement hearing with sight. For me, building them connects signal processing to emotion—every waveform becomes a pattern, and every beat becomes motion. It’s a reminder that creativity often begins where science and perception overlap.
